Monitoring, Troubleshooting, and Performance Optimization
- -->> 11. Monitoring, Troubleshooting, and Performance Optimization
What you'll learn
 WordPress Site Health MonitoringPerformance Metric InterpretationIssue Identification and TroubleshootingProactive Website Maintenance
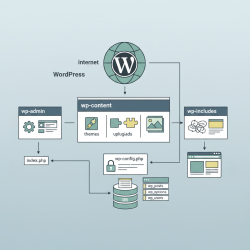
Maintaining a robust and high-performing WordPress website is crucial for online success, whether you're running a personal blog, an e-commerce store, or a corporate portal. A slow or broken website not only frustrates visitors but can also negatively impact your search engine rankings and business goals. Understanding how to effectively monitor your WordPress site's health, swiftly identify potential issues, and accurately interpret performance metrics is fundamental to ensuring a smooth user experience and sustained growth. This comprehensive guide will equip you with the knowledge and tools to keep your WordPress installation in peak condition, allowing you to proactively address problems before they escalate and compromise your online presence.
Understanding the WordPress Site Health Tool
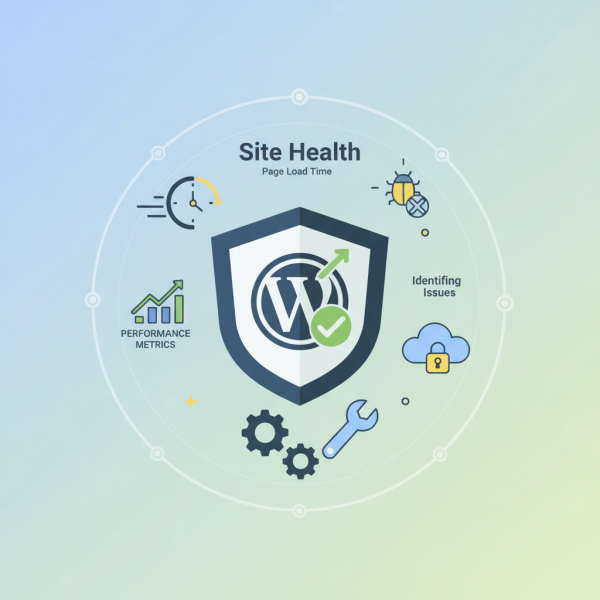
WordPress itself includes a built-in Site Health tool, found under "Tools" in your dashboard. This valuable utility provides an overview of your site's configuration and highlights areas that may need attention. It performs various checks, categorizing issues as "critical" or "recommended improvements."
The Site Health Status tab gives you a performance score and lists specific items that need resolution. These often include outdated PHP versions, missing recommended modules, inactive plugins or themes, and potential security vulnerabilities. Regularly reviewing this section is your first line of defense against common problems.
The Site Health Info tab offers a detailed breakdown of your WordPress installation, server environment, database, themes, and plugins. This information is incredibly useful for debugging or when seeking support, as it provides a comprehensive snapshot of your system's specifics.
Key Performance Metrics to Monitor
Beyond the internal Site Health tool, external metrics provide deeper insights into your site's actual performance from a user's perspective. Focusing on these metrics helps ensure a fast and responsive website:
- Page Load Time: The total time it takes for a page to fully display in a browser. Faster load times improve user satisfaction and SEO.
- Time to First Byte (TTFB): Measures the responsiveness of a web server. It's the time from the user making a request to the first byte of the page being received by the browser. A high TTFB often indicates server-side issues.
- Core Web Vitals: Google's initiative to provide unified guidance for quality signals that are essential to delivering a great user experience on the web. These include:
- Largest Contentful Paint (LCP): Measures perceived load speed, marking the point when the page's main content has likely loaded.
- First Input Delay (FID): Measures responsiveness, quantifying the experience users feel when trying to first interact with the page.
- Cumulative Layout Shift (CLS): Measures visual stability, quantifying the amount of unexpected layout shift of visual page content.
- Resource Usage: Monitoring CPU, RAM, and disk I/O on your hosting server ensures your site has adequate resources to handle traffic without slowing down.
- Uptime: The percentage of time your website is available and accessible online. Downtime means lost visitors and potential revenue.
Identifying Potential Issues
Pinpointing the root cause of performance degradation or errors requires a methodical approach. Common culprits include:
- Outdated Software: Neglecting to update WordPress core, themes, and plugins can introduce vulnerabilities and performance bottlenecks.
- Plugin Conflicts: Malfunctioning or poorly coded plugins can clash with each other or the WordPress core, causing errors or slowdowns.
- Theme Issues: Bloated or inefficiently coded themes can significantly impact page load times.
- Database Problems: An unoptimized or bloated database with unnecessary data (e.g., post revisions, spam comments) can slow down content retrieval.
- Hosting Limitations: Insufficient server resources (CPU, RAM) from your web host can lead to sluggish performance, especially under traffic spikes.
- Security Breaches: Malware or hacks can consume server resources, redirect traffic, or deface your site, severely impacting performance and trust.
Tools like browser developer consoles (for network errors and slow scripts), error logs (via your hosting control panel), and dedicated debugging plugins can help uncover these issues.
Tools for Advanced Monitoring and Analysis
While WordPress offers basic insights, more sophisticated tools are essential for comprehensive monitoring:
- Google Analytics: Tracks user behavior, traffic sources, and page load times.
- Google Search Console: Provides insights into your site's performance in search results, including Core Web Vitals reports and crawl errors.
- Uptime Monitoring Services: Services like Uptime Robot or Pingdom continuously check your site's availability and notify you instantly of downtime.
- Performance Testing Tools: GTmetrix, PageSpeed Insights, and WebPageTest analyze page speed, identify bottlenecks, and offer optimization suggestions.
- Security Scanners: Sucuri, Wordfence, or MalCare help detect and remove malware, ensuring your site remains clean and secure.
Interpreting Performance Data
Raw data is only useful if you can understand what it signifies. A consistently high TTFB, for instance, might point to an overloaded server, a slow database query, or issues with your CDN. A sudden drop in LCP scores could mean a new image or script is delaying the main content rendering. Significant CLS might be due to images without dimensions or dynamically injected content.
When analyzing performance reports, look for trends over time rather than isolated incidents. Compare current metrics against previous periods or after making changes to your site. This contextual understanding helps you determine if an issue is new, persistent, or a result of a specific modification. Prioritize issues based on their impact: critical errors affecting site availability or security should always take precedence over minor aesthetic adjustments.
Proactive Maintenance for Optimal Health
The best way to ensure a healthy WordPress site is through consistent, proactive maintenance. This includes:
- Regular Updates: Keep WordPress core, themes, and plugins updated to their latest versions to benefit from performance improvements, bug fixes, and security patches.
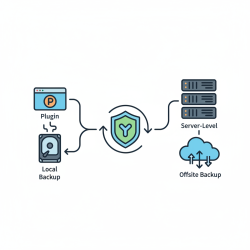
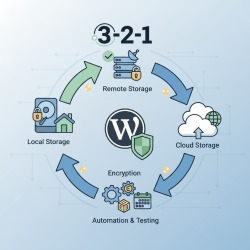
- Daily Backups: Implement an automatic backup solution. In case of an issue, a recent backup can save you hours or days of recovery work.
- Database Optimization: Regularly clean and optimize your database to remove unnecessary data and improve query speeds.
- Caching: Utilize caching plugins (e.g., WP Rocket, LiteSpeed Cache) to serve static content faster and reduce server load.
- Image Optimization: Compress and resize images before uploading them to reduce file sizes without sacrificing quality.
- Security Hardening: Implement security best practices, such as strong passwords, two-factor authentication, and a robust security plugin.
- Reviewing Logs: Regularly check server error logs and WordPress debug logs for early warning signs of problems.
Summary
Monitoring WordPress site health and performance is an ongoing process that combines internal tools with external metrics and proactive maintenance strategies. By leveraging the built-in Site Health tool, closely tracking key performance indicators like Core Web Vitals and page load times, and employing advanced monitoring solutions, site administrators can effectively identify and troubleshoot potential issues. Interpreting data trends, understanding common problem sources, and implementing a regimen of regular updates, backups, and optimizations are essential steps to maintaining a fast, secure, and reliable WordPress website that consistently delivers an excellent user experience. Investing time in these practices will safeguard your online presence and support your long-term objectives.
Comprehension questions
 What is the primary purpose of the WordPress Site Health tool, and what kind of information does it provide?Name three key performance metrics that site administrators should regularly monitor for their WordPress website.Describe two common types of issues that can negatively impact WordPress site performance and how they might be identified.Why is proactive maintenance, such as regular updates and backups, considered crucial for optimal WordPress site health?
Community Poll
Next Lesson

Course Contents : Mastering WordPress Site Maintenance
- >> 11.
 Monitoring, Troubleshooting, and Performance Optimization