Measuring Website Performance to Uncover Bottlenecks
- -->> 2. Measuring Website Performance to Uncover Bottlenecks
What you'll learn
 Performance Tool UtilizationKey Metric UnderstandingBottleneck IdentificationOptimization Strategy
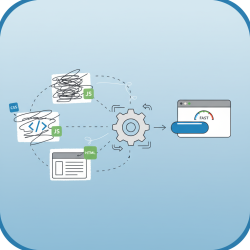
Slow websites lead to higher bounce rates, reduced conversions, and a negative impact on your brand's reputation. Measuring performance effectively is the first crucial step towards optimization, allowing you to pinpoint exactly where your site is lagging. Fortunately, a suite of powerful tools exists to help developers and website owners diagnose performance bottlenecks: Lighthouse, PageSpeed Insights, and GTmetrix. Mastering these tools is essential for anyone serious about delivering a stellar online experience.
Why Website Performance Matters
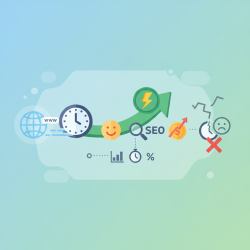
The speed at which your website loads directly influences user engagement and satisfaction. A delay of even a few seconds can significantly increase the likelihood of a visitor abandoning your site. Beyond user experience, search engines like Google use page speed as a ranking factor, meaning faster sites are more likely to appear higher in search results. This directly translates to better visibility and potential organic traffic.
Furthermore, poor performance can have a tangible impact on your business's bottom line. E-commerce sites, for instance, often see a direct correlation between page load times and conversion rates. Every millisecond shaved off loading time can contribute to increased sales and revenue. Understanding and addressing performance issues is a strategic investment.
Understanding Performance Metrics
Before diving into the tools, it's vital to grasp the key metrics they measure. These metrics provide a standardized way to evaluate and compare website performance:
- First Contentful Paint (FCP): Measures the time from when the page starts loading to when any part of the page's content is rendered on the screen.
- Largest Contentful Paint (LCP): Measures the time when the largest image or text block in the viewport is visible. This is a crucial metric for perceived loading speed.
- Cumulative Layout Shift (CLS): Measures the sum total of all individual layout shift scores for every unexpected layout shift that occurs during the entire lifespan of the page. A low CLS means the page is stable.
- Total Blocking Time (TBT): Quantifies the total amount of time that a page is blocked from responding to user input, such as mouse clicks or screen taps.
- Speed Index: Measures how quickly content is visually displayed during page load.
- Time to Interactive (TTI): Measures the time it takes for a page to become fully interactive, meaning it can respond reliably to user inputs.
These metrics, often referred to as Core Web Vitals and other performance scores, paint a comprehensive picture of your site's speed and responsiveness.
Lighthouse: Your In-Browser Audit
Lighthouse is an open-source, automated tool for improving the quality of web pages. It's built into Chrome DevTools, making it easily accessible for developers. Lighthouse audits cover performance, accessibility, best practices, SEO, and Progressive Web App (PWA) considerations.
To use Lighthouse, simply open Chrome DevTools (F12 or right-click -> Inspect), navigate to the "Lighthouse" tab, and click "Generate report." You can choose categories to audit and whether to run it on desktop or mobile. The report provides a score for each category, along with detailed recommendations for improvements, categorized by severity and estimated savings.
Lighthouse runs a simulated audit, which means it uses a throttled network and CPU to simulate real-world conditions on average devices. This provides a consistent baseline for comparison, regardless of your local internet speed or computer's power.
PageSpeed Insights: Google's Perspective
PageSpeed Insights (PSI) is a Google-developed tool that reports on the performance of a page on both mobile and desktop devices. What makes PSI unique is that it provides both "field data" (real user data from the Chrome User Experience Report) and "lab data" (data from a simulated load, powered by Lighthouse).
By entering a URL into PSI, you get a score and recommendations similar to Lighthouse, but with the added context of how real users experience your site. The field data is invaluable as it reflects actual user interactions and network conditions, providing a crucial reality check to the lab data's controlled environment. PSI emphasizes Core Web Vitals, highlighting specific areas where your site might be falling short for real users.
GTmetrix: Deep Dive into Loading
GTmetrix offers another robust platform for analyzing website performance. While also utilizing Lighthouse, GTmetrix adds its own FCP (formerly YSlow) grade and a comprehensive waterfall chart, which visualizes the loading behavior of every single resource on your page.
The waterfall chart is incredibly powerful for identifying bottlenecks. It shows the exact sequence in which resources load, their size, and how long each one takes. You can quickly spot render-blocking resources, large images, or slow server responses. GTmetrix also allows you to test from various global locations and with different connection speeds, providing a more diverse performance perspective than single-point testing tools.
Key features of GTmetrix include detailed reports, video playback of your page loading, and the ability to monitor performance over time through scheduled tests. This helps track improvements and regressions.
Interpreting Results and Taking Action
Once you have reports from these tools, the real work begins. Don't just look at the scores; delve into the recommendations. Prioritize fixes based on their impact and ease of implementation. Common areas for improvement include:
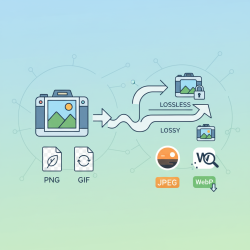
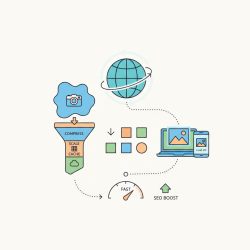
- Optimizing images (compression, proper sizing, next-gen formats).
- Minifying CSS and JavaScript files.
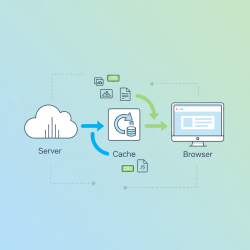
- Leveraging browser caching.
- Reducing server response time.
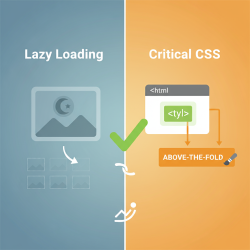
- Eliminating render-blocking resources.
- Implementing lazy loading for images and videos.
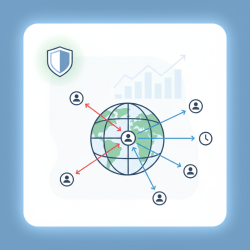
- Using a Content Delivery Network (CDN).
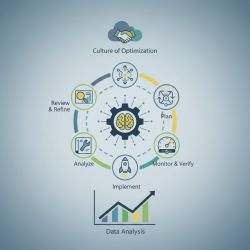
Continuously retest after implementing changes to measure their effectiveness. Performance optimization is an ongoing process, not a one-time fix.
Common Performance Bottlenecks
Identifying the root causes of slow performance is key. Some of the most frequently encountered bottlenecks include:
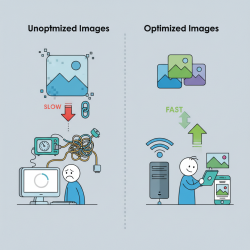
Large Image Files: Unoptimized images are often the biggest culprits, leading to significantly longer download times. Compressing images and serving them in modern formats can yield substantial improvements.
Excessive JavaScript: Too much JavaScript, or unoptimized JavaScript, can block the main thread, delaying rendering and interactivity. Deferring or asynchronously loading scripts can mitigate this.
Inefficient CSS: Large or unoptimized CSS files can also be render-blocking. Minifying CSS and removing unused styles can help.
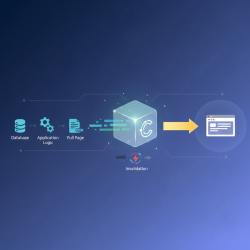
Slow Server Response Times: This can be due to poor hosting, inefficient database queries, or unoptimized server-side code. Improving server-side performance is fundamental.
Render-Blocking Resources: Scripts and stylesheets that are not critical for the initial page render can block the browser from displaying content. Properly structuring your HTML and CSS to avoid this is crucial.
Too Many HTTP Requests: Each request adds overhead. Combining files, using CSS sprites, and reducing the number of external resources can help.
Summary
Mastering website performance is critical for user satisfaction, SEO, and business success. Tools like Lighthouse, PageSpeed Insights, and GTmetrix provide invaluable insights into your site's speed and efficiency. Lighthouse offers a comprehensive in-browser audit with actionable recommendations, while PageSpeed Insights complements this with real-user field data and a focus on Core Web Vitals. GTmetrix provides a deeper dive with its waterfall chart and multi-location testing, helping pinpoint specific resource-loading issues. By understanding the metrics these tools report, interpreting their findings, and systematically addressing identified bottlenecks, you can significantly enhance your website's performance, ensuring a faster, more responsive, and ultimately more successful online presence.
Comprehension questions
 What are the three primary tools discussed in the article for measuring website performance?Why is website performance crucial for user experience and search engine optimization?Name two core performance metrics that tools like Lighthouse and PageSpeed Insights report.How does GTmetrix complement Lighthouse and PageSpeed Insights in identifying performance bottlenecks?
Community Poll
Next Lesson

Course Contents : Website Speed Performance Optimization
- >> 2.
 Measuring Website Performance to Uncover Bottlenecks